Cook Islands Natural Heritage Articles
El Niño: Droughts, Cyclones and Coral Bleaching
During the summer of 1982-83 Rarotonga experienced a severe drought. Although some water continued to flow into the mains, there was only enough for those near the source – remote areas, like Nikao and Arorangi, were lucky to have a trickle after midnight when the upstream users were asleep. In some areas trucks filled temporary tanks in the streets, and householders carried it in buckets into their homes.
As the drought progressed we learnt that many other parts of the world were also having unusual weather – droughts in some places, torrential rain in others. We were also told that the cause was something called El Niño. Apparently about a hundred years ago Peruvian fishermen noticed that the arrival of a warm ocean current around Christmas was the first indication of a disastrous fishing season, and widespread heavy rain causing landslides and floods. Because of its arrival time they called it the “current of the (Christ) Child”. Gradually the current and the associated weather became known as El Niño, variously translated as “the Christ child”, “the Child”, or “the little Boy”.
After the extreme 1982-83 event scientists became very active in seeking to explain and predict such irregular weather events. As a result the term El Ni ñ o was soon joined by others: Southern Oscillation (SO), Southern Oscillation Index (SOI), ENSO (El Niño and Southern Oscillation), and Warm Event. More recently we have learnt that after an El Ni ñ o the weather may overshoot “normal” and go to the opposite extreme. This “opposite of El Niño” is a La Niña (“the girl child”) – or a Cold Event, because conditions off Peru are colder than usual.
El Niño and our droughts
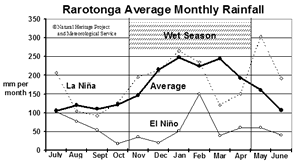 El Niño events affect climate in different places in different ways. For example, in the Northern Group it means more rain than usual, while in the Southern Group it means less rain. The bold line on the “Rarotonga Average Monthly Rainfall” graph shows the long-term average-monthly rainfall for Nikao, plotted from mid-year to mid-year. It shows that from July to October the rainfall is around 110mm-per-month. Our “official” Wet Season starts in November, and this corresponds with a slight rise to 150mm average. Throughout the rest of the Wet Season, December to April, the average is 200-250mm-a-month. May is usually wetter than November, and by June the average is around 110mm again.
The El Niño line shows the average-monthly rainfall for the 1982-83 and 1997-98 severe El Niño events. It shows a drastic decline in the average rainfall during August and September, and a continued average of 50mm or less throughout the Wet Season, and this continued into the following Dry Season. (During each El Niño event “the little boy” had an unusually large mimi in February, which rather spoilt his line!). Another way to measure the effect of El Niño on rainfall is to compare Wet Season average-totals. The long-term average-total is 1,270mm for the 6-month Wet Season, while the average-total for the two severe El Ni ñ o events was only 358mm, or 35% of the long-term average.
The La Niña line, based on the severe 1988-89 and 1998-99 events, shows that overall rainfall was not much greater than the long-term average – obviously, little girls are nearer to “normal” than little boys.
While dramatic changes in rainfall are an obvious effect of El Niño events this is not the way in which scientists measure such events.
Measuring and predicting El Niño
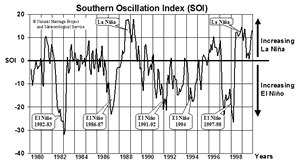 For many years scientists had known that the atmospheric pressure over the eastern South Pacific was usually greater than over Indonesia and northern Australia – usually measured at Tahiti and Darwin. At irregular intervals this pressure difference weakened and, sometimes, reversed. This oscillation of air pressure each side of the South Pacific was known as the Southern Oscillation (SO). The measurement of this pressure difference is known as the Southern Oscillation Index (SOI), and the turbulent line on the “Southern Oscillation Index” graph is the SOI from 1980 to 2000.
In the summer of 1982-83 the index line was very negative, lower than –30. After that severe El Niño, the index rose to fluctuate about the zero point until late 1986 when it dropped dramatically for the 1986-87 El Niño. It then rose beyond zero to settle for a year above +10, the La Niña of 1988-89. During the next five years it was continuously negative with distinct troughs in 1991-92 and 1994. The final drop in the index was in 1997 for the major 1997-98 El Niño, which was followed by a La Niña.
It is obvious that the South Pacific’s Southern Oscillation and the Peruvian El Niño events are linked, and scientists like to show this by combining the names El Niño and Southern Oscillation. Fortunately this shortens to the acronym ENSO. The SOI is an ideal measure of the ENSO status at any given time, and it also shows El Niño events as they start to develop enabling people to be forewarned.
Although we have focused on the last twenty years, research shows that El Niño events have been occurring every three to eight years since weather records started in the late 1700s, and fossil evidence shows El Niño events going back thousands of years.
Winds and ocean currents
The ocean and the atmosphere form a gigantic machine whereby differences in the Sea Surface Temperature (SST) drive the winds, and the winds in turn drive the ocean currents.
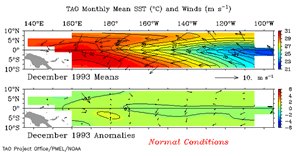 The sun heats the ocean more at the Equator than elsewhere and, in turn, the hotter the ocean the more it heats the air and causes it to rise. This belt of rising air along the Equator lowers the air pressure so that air moves in from the cooler belts south and north of the Equator. If the earth were stationary this movement or wind in the South Pacific would blow due North. However, the earth’s rotation causes it to bend to the west, such that the prevailing winds of the South Pacific are the Southeast Tradewinds, blowing from the southeast to the northwest. In the North Pacific the southward wind is also bent westward to form the Northeast Tradewinds. Because the South Pacific is much larger than the North Pacific, the Southeast Trades are much stronger than their northern counterparts, and the two systems meet or converge north of the Equator to create a windless belt known as the Doldrums.
The Tradewinds blow the surface waters towards the Equator where they meet and form a gigantic westward current, the Equatorial Current. The larger southern component is actually separated from the northern component by a small back-flowing or eastward current called the Equatorial Counter Current in the Doldrums.
The winds of Peru and northern Chile also push the surface waters towards the great Equatorial Current, and this surface water is replaced by cool water coming up the coast in the Peru (Humbolt) Current and by the upwelling of cool waters from the bottom of the ocean. This rising water is rich in nutrients and it creates a fertile band along the Peru coast, about 400km wide. These fertile waters enable minute floating plants to flourish, which enable herbivorous animals, such as the anchovy, to flourish, which enable carnivorous fishes, seabirds and other animals to flourish. The abundance of marine life in coastal Peru is immense - during the 1960s the Anchovetta or Peru Anchovy fishery provided 20% of the total world catch of fish.
As the gigantic Equatorial Current flows westward it is heated by the sun such that water entering at 23 °C near Peru is over 30 °C west of Fiji. When all this hot water arrives in Indonesia its forward path is blocked by large islands and continents. It is forced to flow northward towards Japan, and southward down the Queensland coast, with some escaping into the Indian Ocean south of Java. This hot water evaporates readily and the rising air forms rain clouds to make the area around Indonesia one of the wettest in the world.
Under normal conditions of persistent Tradewinds the escape routes for the hot water are inadequate and it piles up to form a pool with the surface about 50cm higher than the ocean level in the eastern Pacific. The pool of hot water is rather uniform down to around 200m where it is 27 °C and there is a zone of rapid cooling – this zone, with 27 °C at the top, is called a thermocline. The layer of warm water on top of the thermocline becomes shallower as we more eastward along the Equator – around 100m deep in the Northern Cook Islands and less than 50m deep near South America. The “Non-El Niño” illustration shows the effects of strong Tradewinds.
During the southern summer the Southeast Tradewinds weaken, the westward Equatorial Current weakens, and the pile of hot water around Indonesia starts to run downhill back along the Equator in an easterly direction. During normal years this back-flow of hot water does not get half way across the Pacific before the Tradewinds strengthen and push it back onto the pile around Indonesia.
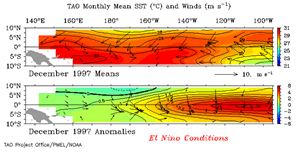 Sometimes, when the Southern Oscillation Index is very negative, the Tradewinds fail to re-establish, and may even reverse for days at a time. Under these conditions the pile of hot water continues to flow eastward right across the Pacific to Peru. This is the El Niño current the Peruvian fishermen had noticed arriving around Christmas. The “El Niño” illustration shows the effects of very week Tradewinds.
During the 1982-83 El Niño the warm current arrived off Peru in late September, when the Sea Surface Temperature (SST) rose 4°C and the sea level rose 20cm in 24 hours! A month later the SST was 7°C above “normal”, and the hot water layer was more than 100m deep.
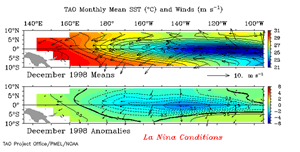 This hot water is poor in nutrients and it floats on top of the cooler nutrient-rich water. Therefore floating plants (phytoplankton) die, the herbivorous fishes and other animal-herbivores die, and, finally, the carnivorous fishes and other animal-carnivores die. For example, at Christmas Island (on the Equator northeast of Penrhyn) there was a colony of 20,000 frigatebirds in June 1982, but by November there were only 100 left – the squid and fishes had gone from the surrounding ocean, the nestlings starved, and the adult frigatebirds had either starved or moved to other islands. Further east in the Galápagos Islands by March 1983 all the fur-seal pups had died of starvation, and the adults were starting to die of starvation. The death of fishes, seabirds and other marine animals in the ocean near Peru was immense. Not only was the hot water floating on the cooler water, but the weak or absent Tradewinds were failing to maintain the nutrient-rich upwelling. The zone of fertile water shrank to less than 30km wide – and life there soon collapsed due to over-harvesting by man, carnivorous fishes, seabirds and other marine animals.
The current of hot water brought its associated cloud and rain across the Pacific. This resulted in increased rain in the Northern Cook Islands, and along the Pacific coast of tropical America, where they experienced widespread landsliding and flooding. The increased rising air in the eastern Pacific also altered the pattern of major air currents in the atmosphere causing extreme atypical weather further afield in the Americas, Caribbean and Atlantic.
Part 2
El Niño and our cyclones
In a typical year the Sea Surface Temperature (SST) across equatorial Pacific is over 30 °C west of Fiji, about 29 °C in the Northern Cook Islands, 25°C at the Galapagos Islands and just over 23°C off Peru. The high SST west of Fiji makes it more likely that a wind disturbance near (but not on) the Equator will “feed” on the moist rising air to develop into a revolving wind system. These revolving wind systems are called cyclones and they are classified as Gales, Storms or Hurricanes, depending on their sustained wind speeds. When the Spanish first settled in the Caribbean they learnt from the Taino people that the large tropical storms were the activity of Huracan, the Wind God. Although the Taino became extinct within a hundred years of meeting the Spanish, the name of their Wind God survives as the word Hurricane.
During most years the gigantic pool of hot water is well west of Fiji and that is typically where most cyclones form. As we move eastward the likelihood of tropical cyclones gets less and less, such that the Cook Islands usually has less than one cyclone a year. On the graph the cyclones for each summer are shown along the bottom, and it can be seen that one or zero is the situation most years.
However when that current of hot water flows eastward along the Equator it moves the likelihood of the winds developing into cyclones to the east also. The extreme is during a severe El Niño when a belt of 29-30 °C water reaches right across the Pacific. During these times we usually see the number of cyclones in the Cooks Islands doubling and tripling: 2, 3, 3, 1 and 5. During the last twenty years the Cook Islands has had about 20 cyclones, with an average of 0.8 cyclones during non-El Niño summers, and 2.8 cyclones during El Niño summers.
Ocean currents and our SST
We have already discussed how the Southeast Trades drive water westward along the Equator and how when the Tradewinds weaken the hot water flows back across the Equator to dramatically raise the water temperature in the equatorial eastern Pacific.
The Northern Cooks is on the southern edge of the Equatorial Current and it normally has a summer SST of 29 °C and a winter SST of 28 °C . During an El Niño the hot water moving eastward gives higher summer SST of about 29.5 °C .
In the Southern Group the Sea Surface Temperature is lower, and it varies more between summer and winter. The SST for the Southern Group is usually 27.5 °C in summer , and 3 °C lower during winter at 24.5 °C . Because the ocean currents affecting areas away from the Equator are more complex the spread of the hot water is also more complex. In general, during the summer of an El Niño event the SST in the Southern Group is slightly lower than for an average summer, while the following summer it is hotter than average. The only time the Southern Group has had summer SSTs of more than 28 °C has been during or after an El Niño.
During these summers of unusually high SSTs many corals die.
Corals as builders and gardeners
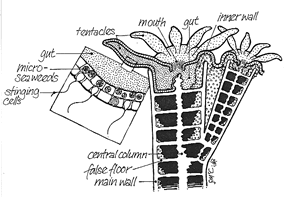 Corals are soft animals, called polyps, that live in small holes on the surface of limestone rocks in warm tropical seas. Each rock is like an apartment building that is never finished. The builders live in apartments on the top floor and, instead of putting on roofs, they keep building the walls higher and higher. When the walls are too high the polyp inserts a false floor – a floor with a gap between the old and new to reduce the amount of limestone needed. In this way, as the limestone rock grows, the polyps remain on the surface in roofless apartments where they can bathe in sunlight and wave their feeding tentacles in the surrounding water. Neighbouring polyps share a continuous skin, which means they can communicate with each other and secrete limestone into the gaps between their apartments.
The tentacles of each coral animal or polyp have stinging-cells to capture minute plants and animals that touch them. Unfortunately the polyps usually fail to catch enough food and would die if they were not good gardeners also. In their jelly-like skin they have lots of yellow-brown micro-seaweeds or micro-algae. These micro-seaweeds take in sunlight to make sugars and other foods for themselves, and they share their food with the coral animal. Scientists rarely miss an opportunity for a big word, so they called these micro-seaweeds, zooxanthellae – literally “little yellow animal-lovers”.
Although coral animals can manufacture tough limestone “homes”, and have gardens of micro-seaweeds to feed themselves, they live a precarious existence. They need lots of oxygen for themselves, and lots of sunlight for their micro-seaweeds. They need salty water – but not too salty; they need warm water – but not too warm. The ideal conditions for a coral are found in the top ten meters of tropical oceans and, naturally, that is where most corals grow.
Corals are destroyed when any vital condition changes in an unacceptable way. For example, after heavy rain volcanic soil wash from inland Rarotonga down the streams and onto the corals of the reef. This cloud of brown particles starves the micro-seaweeds of the sunlight they need, and it starves the coral animals by clogging its feeding mechanism. If this type of pollution is not removed within a few days, the corals die.
Corals need warm water. They cannot survive in temperatures lower than 21°C, and in the South Pacific temperatures above this occur southward to about 25°S, which means that all islands of the Cook Islands have live coral reefs. But more southern islands in Polynesia, like Rapa, Pitcairn and Rapanui, do not have coral reefs. It is also surprising to learn that the Marquesas Islands have no coral reefs and few corals even though they are at the latitude of Manihiki - about 10°S. This happens because the cold Peru Current joins the Equatorial Current and some of its cool water reaches the Marquesas Islands.
El Niño and our Coral Bleaching
Coral animals are delicate and sensitive. They have narrow tolerance limits to pollutants, saltiness, UV-light and temperature. When any of these factors goes above or below the narrow limits the coral is stressed and eventually it dies.
During and soon after the 1982-83 El Niño marine biologists for the first time recorded corals turning white in many tropical areas. This phenomenon has occurred with each El Niño , and the most serious and widespread episode occurred with the 1997-98 El Niño event .
In some areas some of the corals recovered, but in most they died. This widespread phenomenon was called “coral bleaching” because the corals turned white for several days before they actually died. The stress caused the corals to ejected their gardens of colourful micro-seaweeds (zooxanthellae), and they appear bleached because you can see the fresh limestone through their colourless tissues. If the stress was removed within a few days some corals were able to re-establish their internal gardens and survive.
The scientific evidence shows that the main stressor, causing the widespread coral bleaching associated with El Niño events, is high water temperatures. In any given area, many corals are living near the upper limit of their temperature tolerance and a slight increase of even 1 °C will bleach some species, and a rise of 2°C will bleach many species. Although a temperature rise alone is enough to bleach and kill corals, the stress is compounded by the presence of any other stress factors, such as windless days allowing more UV-light to reach corals, or low tides causing increased saltiness in lagoons.
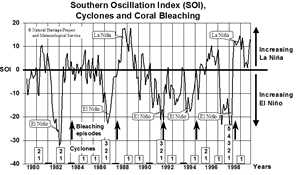 The graph shows the main bleaching events for the Society Islands, and the situation is probably very similar for the Southern Cook Islands. The bleaching episodes are shown as upward pointing arrows, and it can be seen that the five main bleaching episodes follow the five main El Niño events .
Although widespread coral bleaching is linked to El Niño events , some areas, such as the Cook Islands and French Polynesia, also experience localised non-El Niño coral bleaching. For example, there was a coral bleaching episode in the Rarotonga lagoon during March this year. If you snorkel in the Tikioki Ra‘ui area you will see that some species of coral are commonly bleached. Sometimes the tips of the staghorn corals turn a bright purple, before they are fully bleached.
The widespread death of corals by temperature-induced coral bleaching is very damaging. When the corals are dead an important habitat and food source is removed from the reef. The newly exposed coral limestone encourages the grown of some types of the larger seaweeds and these provide food that encourage different species of fishes to flourish. The biological balance of the reef system is thrown out of gear. And if coral bleaching episodes are frequent only those coral species that can tolerate the higher temperatures will survive - leading to a change in the composition of the biological community. For example, a major factor in the loss of corals in Aitutaki lagoon, during the last 15 years, was El Niño-induced coral bleaching episodes.
El Niño-induced coral bleaching is a major threat to Cook Islands marine biodiversity, and a serious threat to the tourist industry.
El Niño and Global Warming
An El Niño event is a very negative event for the Cook Islands – more droughts (Southern Group only), more cyclones, and more bleached corals. The big question is: Are El Niño events increasing in frequency and severity?
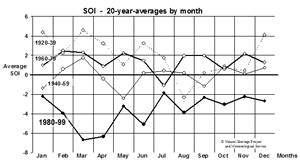 Since weather records started in the late 1700s there have been El Niño events. Each line on the “SOI – 20 year averages” graph shows the average SOI for each month for a 20-year period in the last 80 years. The lines fluctuate up and down during the year. The three lines for the periods 1920-39, 1940-59 and 1960-79 are running over each other and fluctuate up and down over the zero level. But look at the 1980-99 line – it runs much lower than all the others. This graph shows that the last 20 years has been more El Niño-prone than any 20-year period before.
The conclusion is obvious: El Niño events have become more severe and more common in the last 20 years. The final question is: what is the connection between El Niño events and Global Warming?
At the very least we can conclude that any temperature rise due to Global Warming will be added to the temperature effects of an El Niño event. This means that any given El Niño will be more severe with Global Warming than without. Every government and every individual should take immediate action to reduce their contribution to Global Warming.
Some scientists have also concluded that Global Warming is the cause of the recent increased frequency of El Niño events. If this is the case, it means that reducing Global Warming would reduce the frequency of El Niño events, in addition to reducing the severity of any given El Niño. The problem of Global Warming calls for our most serious consideration.
First published in the Cook Islands News, June 2000
About Gerald McCormack
 Gerald McCormack has worked for the Cook Islands Government since 1980. In 1990 he became the director and researcher for the Cook Islands Natural Heritage Project - a Trust since 1999.
He is the lead developer of the Biodiversity Database, which is based on information from local and overseas experts, fieldwork and library research. He is an accomplished photographer.
Citation Information
McCormack, Gerald (2005) El Niño: Droughts, Cyclones and Coral Bleaching. Cook Islands Natural Heritage Trust, Rarotonga. Online at http://cookislands.bishopmuseum.org. ![]()
Please refer to our use policy
